Should I open a new title for this, I don't know?
I have found that the above query shows exactly the same results as the application. Thank you again.
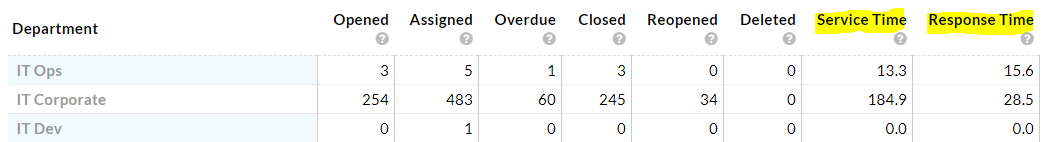
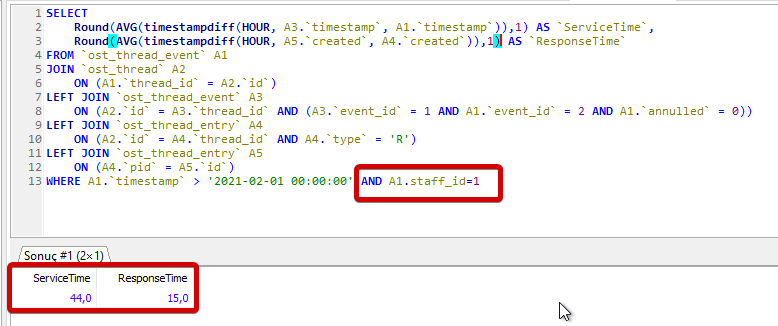
However, I think there is a mistake in the "Response Time" field. Below you can see the result in the "Statistic -> Agent" section of the "Dashboard" screen in the application.
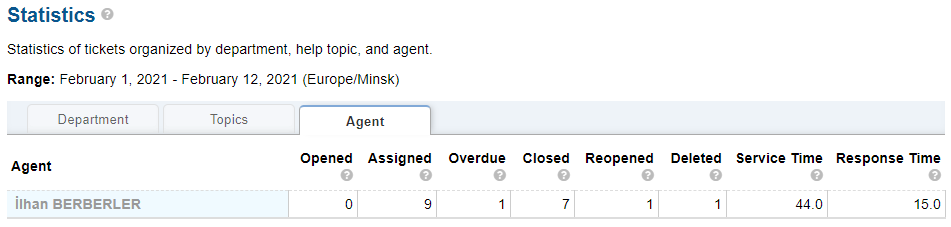
When I run the above query, the result is the same. (I just added A1.Staff_id = 1.)
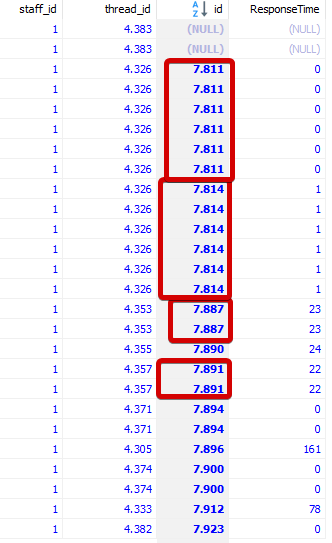
I changed the query as below. The purpose of this is to be able to see the lines that affect the "Response Time" calculation.
SELECT
A1.staff_id,A1.thread_id,A4.id,
TIMESTAMPDIFF(HOUR, A5.created, A4.created) AS ResponseTime
FROM ost_thread_event A1
JOIN ost_thread A2
ON (A1.thread_id = A2.id)
LEFT JOIN ost_thread_event A3
ON (A2.id = A3.thread_id AND (A3.event_id = 1 AND A1.event_id = 2 AND A1.annulled = 0))
LEFT JOIN ost_thread_entry A4
ON (A2.id = A4.thread_id AND A4.type = 'R')
LEFT JOIN ost_thread_entry A5
ON (A4.pid = A5.id)
WHERE A1.timestamp > '2021-02-01 00:00:00' AND A1.staff_id=1
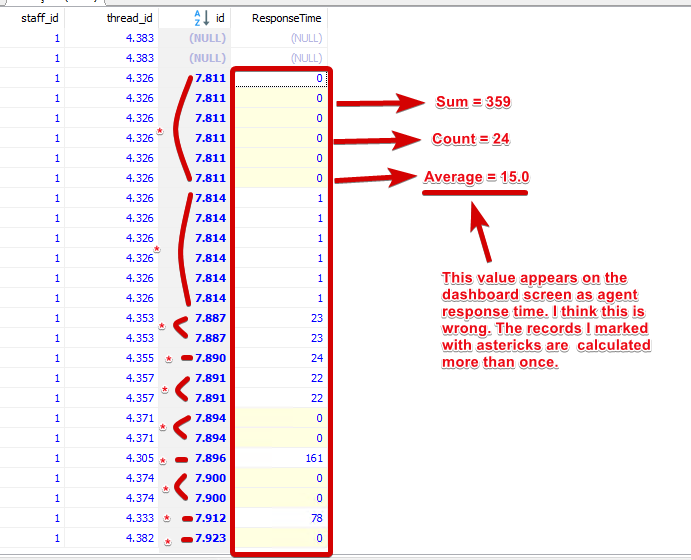
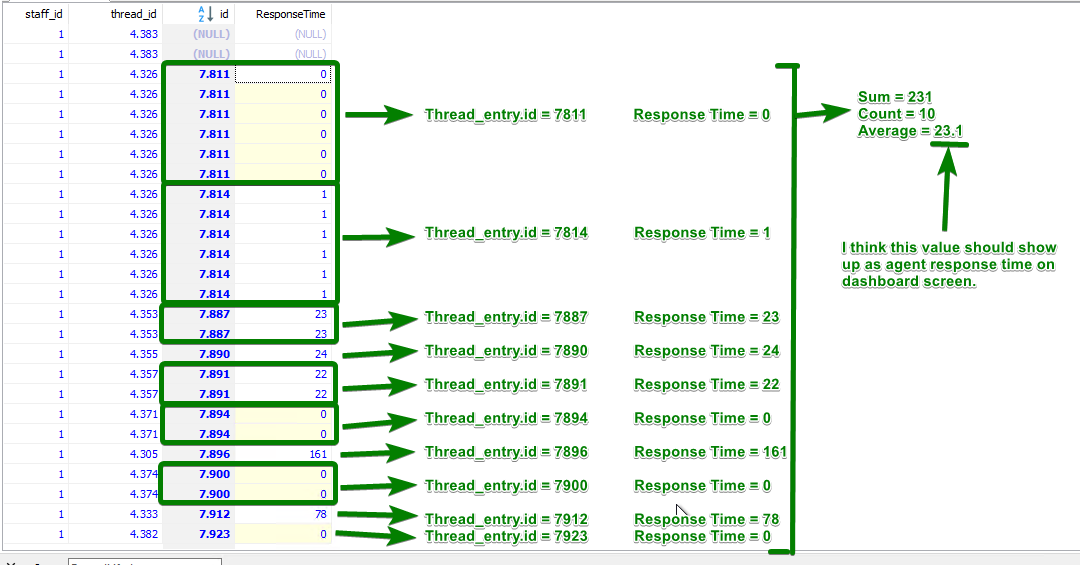
The same "thread_entry" line is evaluated 2 or more times, as you can see below, where you look at the returned result. Therefore, since the average value is displayed one more times here, it cuts the time in down.
Frankly, I want to admit that this is true, but it just doesn't make sense. Would you have a comment?
KevinTheJedi Especially I am waiting for your comments.