Hi

I am running version v1.10.1 (9ae093d) and I would love an explanation of the fields that are on the dashboard. I have searched high and low, however I am not able to get any information. For example what is the service and response time and the numbers that pops up on the graph.

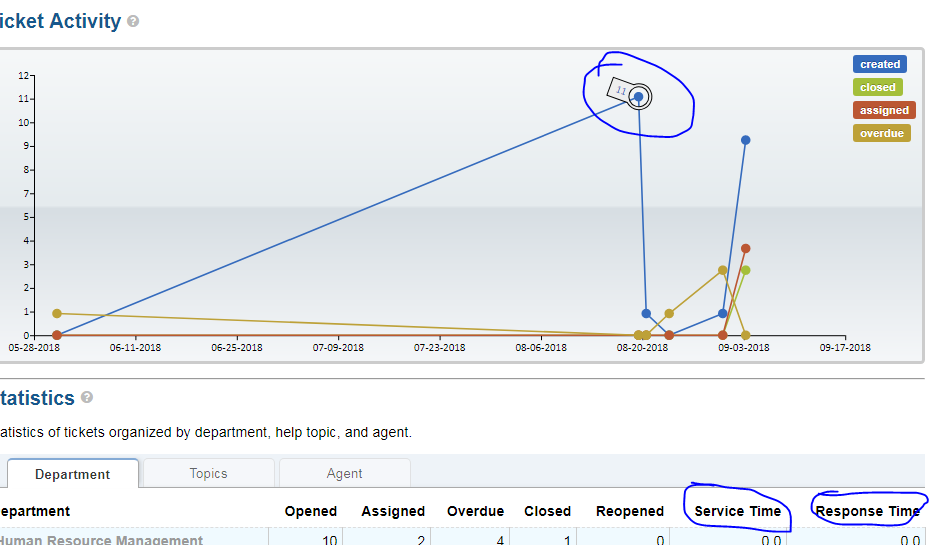
I have a presentation and I am not sure how to explain these to the users.

circled 11. There were 11 tickets created that day.

circled service time. average response time in hours I think.

circled response time. Same as above but the time to response.

Documentation is here: https://docs.osticket.com/en/latest/Agent/Dashboard/Dashboard.html

I found the Dashboard to be less than stellar and do not use the Dashboard. I use a paid 3rd party report plugin.

12 days later
5 years later

Hi, has this been updated recently? The site is empty now.

Regards
Brynley

    @KevinTheJedi - I mean the link to software mods website is a placeholder site now it seems?

    I guess there is no graphical dashboard for osTicket right now?

    Thank you.

      brynley

      Oh, we don’t have any affiliation with that person nor their mods so I’m not sure.

      We do have a graphical, historical overview dashboard in core osTicket under Agent Panel > Dashboard > Dashboard.

      Cheers.

      Write a Reply...