Well I'm getting somewhere I hope :)
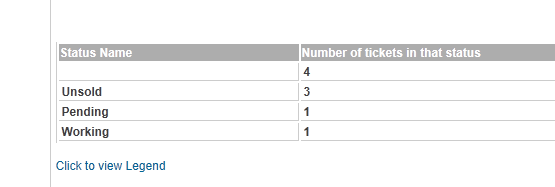
I am now up to a blank (no pie chart) but I am able to split up and view how many tickets are in that status (see attachment) but for some reason my "sold" status does not show up and it's blank :
Here's my code changes so far, maybe somebody can see what I'm doing wrong or what I'm forgetting to add:
First, I added the ability to choose that report around line 63:
<option value="tixSold" <?if($_POST=='tixSold'){echo "selected";}?>>Ticket Status</option>
Then I "think" I'm supposed to wring something and call the DB somehow around line 100 and maybe that's why I'm not seeing a graph
EDIT: forgot to add another thing I added around line 115
elseif($_POST == 'tixSold'){
$qselect = "SELECT
ost_ticket.sold,
COUNT(DISTINCT(ost_ticket.ticket_id)) AS number FROM ost_ticket";
}
going down, I added my new variable to "group by department" at line 227
elseif($_POST == 'tixSold'){
$qgroup = "GROUP BY ost_ticket.sold ORDER BY ost_ticket.sold";
}
I added a variable $Sold = 0; around line 270 because it looked like I needed it for something
Next I added the headings for the table on the bottom around line 360
elseif($_POST == 'tixSold'){
echo "<tr><th>Status Name</th><th>Number of tickets in that status</th></tr>";
}
Finally towards line 400 I added the if else condition to see what status the ticket is in:
elseif($_POST == 'tixSold'){
if($row == NULL){
$row = Sold;
}
elseif($row == 1){
$row = Unsold;
}
elseif($row == 2){
$row = Pending;
}
elseif($row == 3){
$row = Working;
}
echo "<tr style='font-weight: bold;'><td>" . $row. "</td><td>" . $row ." </td></tr> ";;
}
So from the picture, you can see that I have something going but not quite there yet...
any suggestions/comments/hints :
Thanks
Emil